
It’s come to that point in the year where a dramatic market shift is occurring as I write this, and it’s important to convey to potential buyers, sellers, and in between.
Here is brief 24 Month Real Estate History in Fairfield County for single-family homes (for price points within 20% of the median sales price):
- Holidays of 2017 into 2018: Bullish, real estate market is rising, very low inventory, buyers couldn't find homes (Our Message: Sell, Sell, Sell!)
- Spring Market 2018: Average market time was days (especially for ‘normal’ homes), inventory remained low, and prices were rising quickly (Our Message: We Need Inventory!)
- Fall into Holidays 2018: The market remained robust (Our Message: The same);
- Spring Market 2019: The market slowed, inventory came, but buyers weren't buying as quickly, and only the best properties were selling quickly (Our Message: Sell before you can't anymore!);
- July and August 2019: Dead markets, where usually only August is dead due to Vacations (Our Message: Only sell if you have to);
- After Labor Day, 2019: Huge increase in inventory, lack of demand (Our New Message: For the first time in over three years, it's a buyer's market).
Today’s Abridged Summary of the Market
Prices rose in the past 18-24 months, but buyers now have the leverage to get them back down. There is so much inventory out there, that you may have a chance to get a great deal. Interest rates are still depressed, and should remain that way for a few months, thanks to the federal reserve infusing money into the system. Next year is uncertain, so I do encourage you to take advantage of this market (I am biased! But I can't predict next year's activity, so use what we know now). Though I haven't addressed it, the condo market remains pretty competitive because of this upper price point squeeze.
Let’s Look at the Data
One important piece of data that tends not to be top-of-mind is the months of supply in a given town. This is a relationship between the number of homes sold versus the inventory on the market. Or a definition pulled from online:
- Months of supply is the measure of how many months it would take for the current inventory of homes on the market to sell, given the current pace of home sales.
- Months of supply are a good indicator of whether a particular real estate market is favoring buyers or sellers.
Let’s look at the Months of Supply for Norwalk as of August 2019:
This chart shows the most relevant price ranges, with the corresponding number of Sales in the past 12 months, the amount of current Inventory on market, the Months of Supply, and the % of Total Sales for that price range.
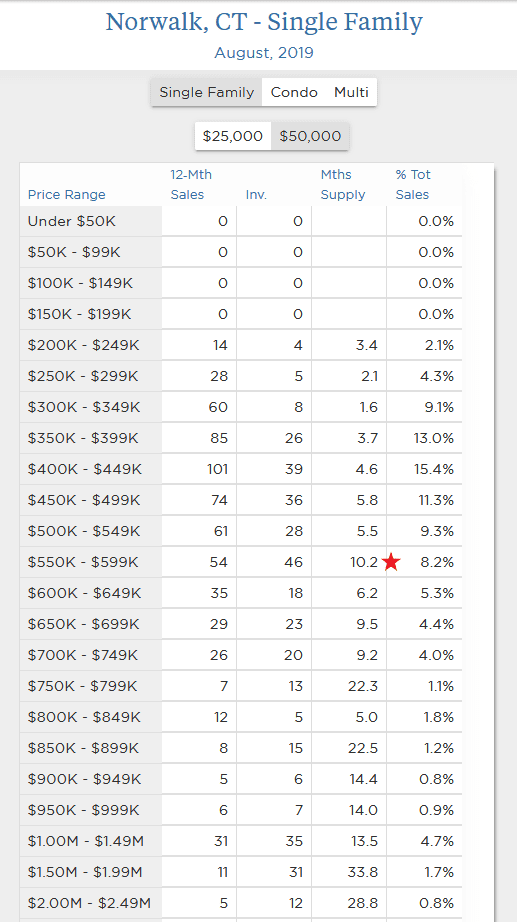
What Does This Information Tell Us About the Norwalk Market?
Under $400,000, the Months of Supply are four months or less (again, if we had no new listings come on, it would take 4 months for total on-market inventory to sell). Between $400,000 and $550,000, that number is closer to 5 or 6. Less than a year ago, I was bullish on the market below $650,000, but we see the 10.2 for $550,000 to $599,000, which is the most worrisome part of the market at the moment. We expect everything above that to be slow, but curiously the 50k price range from $600,000 to $649,000 is at 6 months of supple, 4 months less than the preceding price point and the price points that follow. Beyond that price range, we see a jump in Months of Supply, as expected, similar to last year’s higher price point saturation.
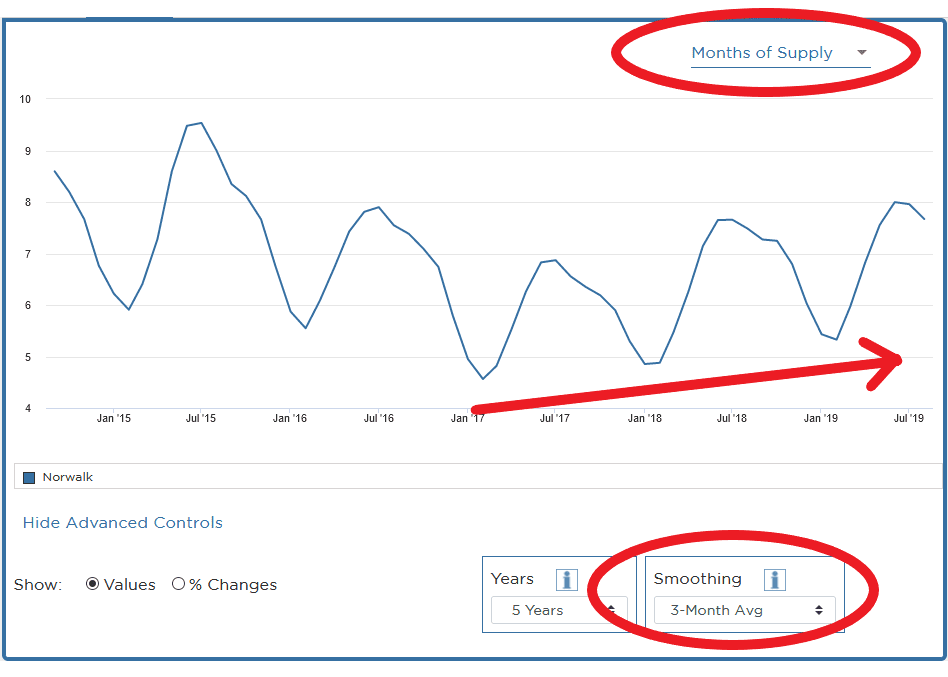
The Months of Supply chart for Norwalk (below) shows that the trend line (with a 3-month moving average) increasing as well, demonstrating the same point over time (instead of the above snippet in time).
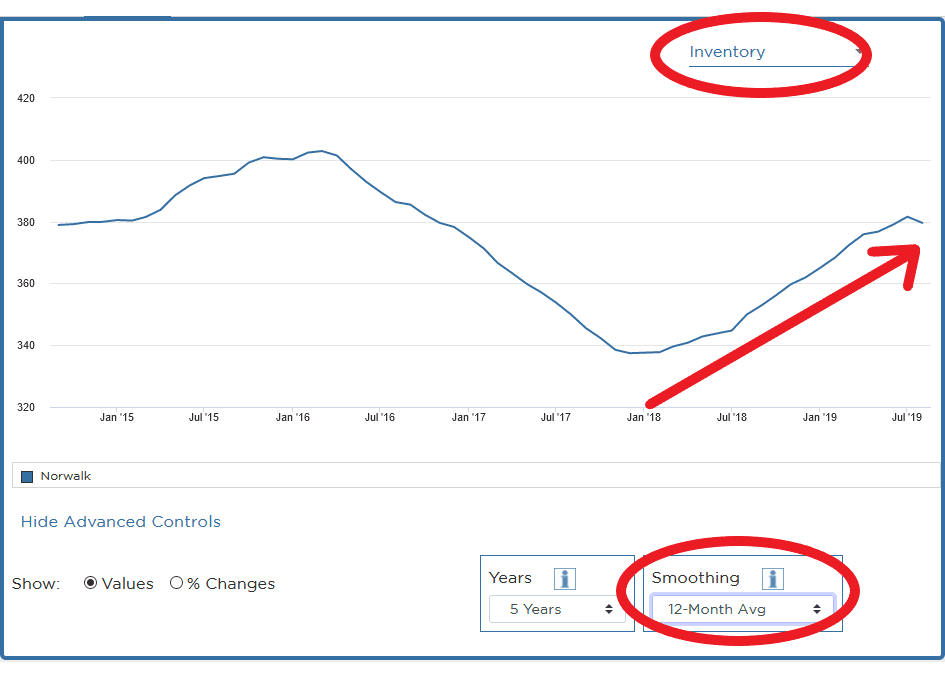
If we were to just take a look at the 12-month moving average of the total inventory in Norwalk (below), we immediately see the same worrying numbers (worrying for sellers), demonstrating a big uptick in inventory from last year. Needless to say, this is great for buyers, as it gives them an opportunity that was missing in 2018.
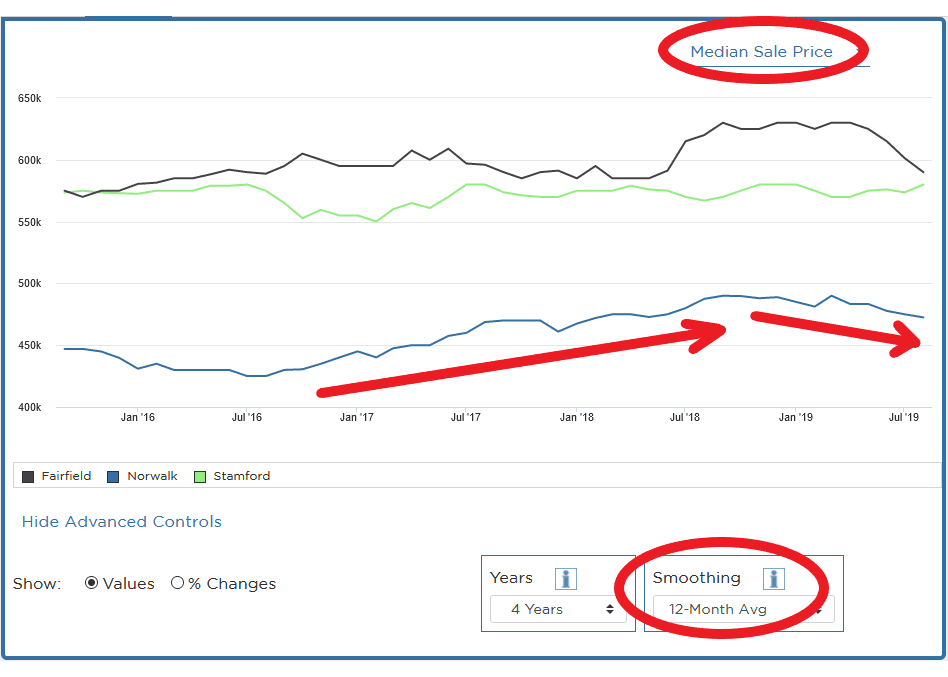
Median Sales Price is also an important factor to discuss. Below, I have used the same 12-month average but included Stamford and Fairfield so there is some relative comparison of trends. These towns see more higher-priced properties selling (another reason why Norwalk was so hot), so we can’t compare prices directly. But, we can see that there is a clear upward trend in price, and a struggle to maintain that as January 2019 came about and prices started to fall again in Norwalk. Stamford increased ever so slightly over the same time, if not stayed mostly stagnant, while Fairfield saw a big jump about a year ago, a plateau, and then a steep decline towards the second quarter of this year.
Taking all of this data together (among many other data points that are not in this blog post), I can definitively conclude that the buyer’s market is upon us, and may stay until at least the end of 2019, if not into 2020. But, 2017 into 2018 saw a huge shift, and mid-year of 2019 saw a huge shift, so (without my psychic abilities) we may see the same into 2020 back to a seller’s market. But, my money is on buyers getting the best out of the Norwalk market in the short term (6-12 months), so let’s take advantage if you were planning to buy anyway.
What Factors Have Led to This Market?
This type of question is probably the most commonly asked when we start talking about market shifts. As you know, I am not a finance expert or someone who predicts trends in the general economy, but I do have a good sense of hyper-local real estate trends and expectations.
So, I believe there are a handful of factors involved that have led to this market:
- Though the standard deduction has increased, the new Tax Plan that went into effect in 2018 squeezed the already-struggling higher price points, especially in Fairfield County. The federal government put a cap on deductions on mortgage interest to the first $750,000 of a loan. They also changed the tax code so that interest on home equity lines of credit cannot be deducted (these don’t affect old mortgage holders, just those buying a new property). The same bill also limits the amount of state and local tax deductions (including property taxes) to $10,000 (both single and married tax filers). Other changes such as eliminating the ability to deduct moving expenses, repealing the Historic Tax Credit, and others, also made it a bit more difficult to afford a new mortgage after the implementation of this bill.
- On a local basis, CT has become the second highest in SALT (State and Local Taxes) in the country, with only Illinois beating us. This makes our SALT 34% higher than the national average. This 14.41% effective tax on residents makes the state less appealing, and as a result, fewer buyers are seeking more affordable small cities in America.
- Prices went up too fast.
- Millennials and younger buyers don’t want to buy big homes anymore. They are opting to buy a condo or a small home that is close to activities, bars, and nightlife.
With the doom and gloom out of the way, Norwalk is still one of the best places to buy within an hour of New York City, which is why it has sustained itself all these years, and in my opinion, increased so quickly last year. Other areas nearby were becoming less attractive and affordable, so we witnessed an influx of new buyers.
What Now?
If you are thinking about buying, the federal reserve has begun to offer ‘repos’ or short-term loans used to regulate our money supply. Without getting into the weeds about this term, it means that interest rates should remain low, and mortgage interest rates will continue to be at a historic low until at least the end of 2019.
This also means that if you were intending to sell, it might be worth waiting to see how the beginning of 2019 fares for sellers, but keep in mind the price might have to be lower than ‘the market value in order to be competitive. Relatively speaking, the price might be lower than today’s home values, but maybe not in 2017 or 2016. This is still a huge jump from 2008 and 2009 when the Recession was in full progress.
Should you have questions, you know where to find me and our team. I hope this market update gives you some great information about the real estate trends locally. I can provide additional data about the real estate market here and nearby if you are interested.